

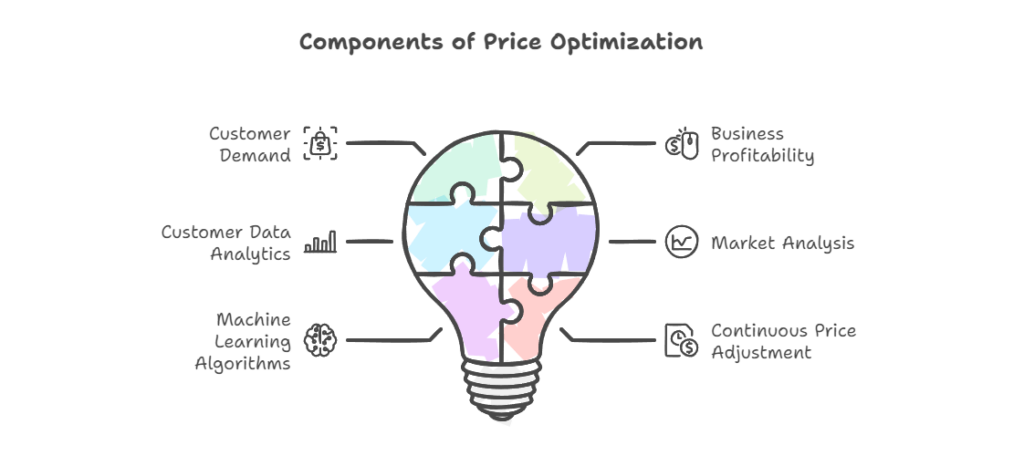
Price remains the single most powerful profit lever a company controls, yet it is often managed by habit and haste rather than data. In a marketplace where competitors adjust tags hourly and consumers comparison‑shop with a tap, organisations that optimise pricing through analytics secure a decisive advantage. Many analysts first grasp the fundamentals—elasticity curves, contribution margins and scenario simulation—during a business analysis course, but turning classroom concepts into production pipelines involves far more than a spreadsheet: it requires reliable data ingestion, rigorous experimentation and robust governance. This expanded guide (approximately 1,200 words) lays out a framework for analytical pricing that balances margin, demand, fairness and sustainability.
1 Collecting and Preparing High‑Quality Data
Every strong pricing model rests on data you can trust. Transaction logs record SKU, list price, discount, tax and pocket revenue. Clickstream events reveal browse‑to‑buy journeys, exposing hesitation points. Web scrapers capture rival catalogues several times per day, and macroeconomic APIs supply inflation, exchange and commodity indices. All feeds land in a cloud lakehouse partitioned by region and time. Schema registries lock field types; quality monitors flag anomalies—null prices, impossible negative quantities—before they poison downstream models. Over time, these checks evolve into data contracts that guarantee freshness and structure, allowing product teams to innovate upstream without breaking revenue dashboards.
2 Descriptive Analytics: Establishing Baselines
Analytics without context misleads. A price waterfall decomposes list price into sequential deductions—promotions, rebates, freight, duties—surfacing hidden margin leaks. ABC segmentation ranks SKUs by cumulative profit share; managers then focus experimentation on the small subset of items producing the bulk of contribution. Time‑series overlays position unit sales against historical price points, illuminating psychological cliffs where demand drops or accelerates, preparing stakeholders for controlled tests rather than surprise revenue shocks.
3 Estimating Demand Elasticity
Economists define elasticity as the total percentage change in overall quantity demanded for a one‑percent change in price. Classical log‑log regressions offer a baseline, yet real‑world data teem with non‑linearities. Gradient‑boosted trees and Bayesian hierarchical models capture interactions between price, seasonality, marketing spend and competitor moves. Partial‑dependence charts translate that complexity into manager‑friendly visuals, showing exactly how a £1 increase affects volumes in each region. These insights inform both everyday discount decisions and long‑range strategic planning.
4 Experimentation at Scale
Modelled elasticity is a hypothesis; controlled experiments supply proof. Randomised price tests validate predictions under marketplace noise. Sequential designs—multi‑armed bandits—dynamically shift traffic toward outperforming variants, extracting uplift faster while capping regret. Guardrail metrics track cart‑abandonment, refund requests and social‑media sentiment to ensure revenue gains do not erode long‑term loyalty. Clear pre‑registration of hypotheses, metrics and stop‑criteria guards against p‑hacking and reinforces analytics credibility.
5 Dynamic and Psychological Pricing Strategies
Charm pricing (£9.99) leverages cognitive bias, and anchor tactics introduce premium decoys that nudge customers toward profitable mid‑tier options. Real‑time engines blend inventory positions, click velocity and competitor scans to refresh offers every hour, bounded by fairness caps that prevent whiplash swings. Reinforcement‑learning agents optimise long‑run revenue, penalising excessive volatility and compliance risk. All algorithmic decisions log feature inputs, recommended prices and realised outcomes, supporting later audit and retraining cycles.
Professional Learning Spotlight
Mid‑cycle skill refresh keeps pricing teams ahead of evolving algorithms. Many practitioners enrol in a project‑oriented business analyst course that focuses on automation pipelines, causal‑impact analysis and policy‑as‑code governance, enabling them to translate statistical findings into board‑level narratives without oversimplifying nuance.
6 Integrating Cost‑to‑Serve and Sustainability
Price strategy cannot ignore cost. Activity‑based costing assigns shipping, storage and service overhead to every SKU, revealing where nominal margins evaporate after fulfilment. Carbon accounting attaches greenhouse‑gas intensity to units, paving the way for eco‑premiums or offset‑backed discounts. Dashboards unite financial and carbon metrics, empowering leaders to pursue profit and sustainability in tandem.
7 Governance, Privacy and Compliance
Algorithmic pricing intersects consumer‑protection law. Governance frameworks impose immutable audit trails for every price change, differential‑privacy noise on individual‑level data and fairness tests across demographic slices. Explainability reports summarise the top factors influencing each suggestion, satisfying regulators while building customer trust. Regular red‑team exercises probe for unfair treatment, ensuring models align with corporate ethics codes.
8 People and Process
Roughly halfway through our journey, attention shifts to talent. Scaling pricing engines demands analysts fluent in statistics, SQL and storytelling. An immersive business analyst course blends these skills with stakeholder‑management drills and ethics workshops. Graduates bridge technical insights with strategic narrative, ensuring data‑driven recommendations earn executive endorsement and operational follow‑through.
9 Operational Monitoring and Alerting
Even well‑tested algorithms drift. Dashboards track revenue per session, discount depth and basket makeup in fifteen‑minute slices. Control‑limit charts catch anomalies—sharp revenue dips from a faulty rule—triggering automatic rollbacks to the last stable configuration. FinOps panels attribute compute spend and carbon footprint to specific models, promoting efficient architecture choices.
Continuous Education Pathway
Approximately two‑thirds into our exploration, firms often encourage analysts to revisit fundamentals via an updated course. New modules cover reinforcement‑learning ethics, green cloud scheduling and zero‑trust data contracts, ensuring teams sustain both technical depth and responsible stewardship.
10 Future Outlook
Large‑language models will soon summarise competitor price moves and classify promotional sentiment at scale, while specialist cohorts within an executive‑focused course will learn to interpret these AI‑generated briefs for strategic steering. Edge‑deployed models will personalise in‑store promotions to local demand, and federated‑learning alliances may enable retailers to share encrypted elasticity insights. Anticipated regulations will mandate real‑time transparency for algorithmic pricing, pushing explainability from a nice‑to‑have to a table‑stake.
Conclusion
Analytics elevates pricing from a quarterly debate to a continuous, evidence‑based loop that balances margin, demand and fairness. Companies that build dependable data foundations, validate elasticity through experimentation and embed governance safeguards set prices reflecting true value while maintaining customer loyalty. Continuous education—grounded in a rigorous business analysis course and reinforced by practice—equips practitioners to navigate evolving markets with confidence. By coupling these competencies with a measurement‑first culture, organisations convert pricing into a strategic lever that powers sustainable growth.
Business Name: ExcelR- Data Science, Data Analytics, Business Analyst Course Training Mumbai
Address: Unit no. 302, 03rd Floor, Ashok Premises, Old Nagardas Rd, Nicolas Wadi Rd, Mogra Village, Gundavali Gaothan, Andheri E, Mumbai, Maharashtra 400069, Phone: 09108238354, Email: enquiry@excelr.com.